

A listing that barely converted can turn into one of your best performers with the right changes. One seller rebuilt a struggling product listing from the ground up and saw conversions jump 304.6%. The results didn’t come from luck or a lucky algorithm update.
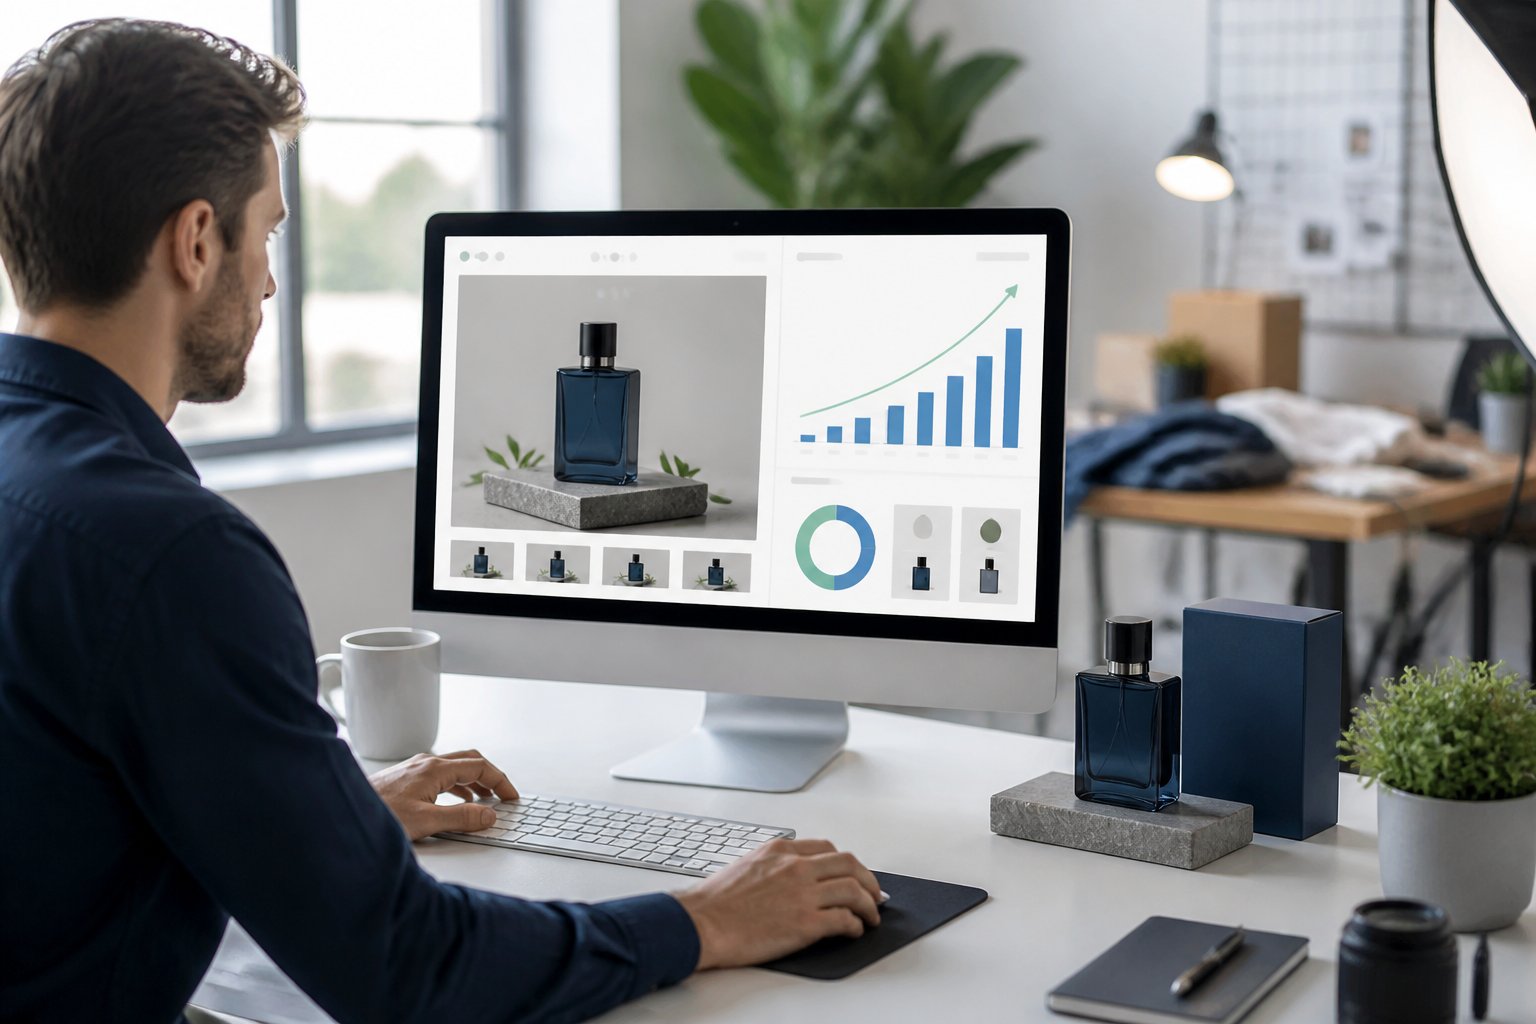
The increase came from a structured process: identifying weak points in the original listing, rewriting key sections, and testing changes based on real buyer behavior. You’ll see what parts of the listing mattered most, what got cut, and what got added. You’ll also learn which changes had the biggest impact and which ones made little difference.
If you’re working with a listing that isn’t converting well, this breakdown gives you a clear starting point. You can apply the same steps to your own products and track your results the same way.
Key Takeaways
- A full listing rebuild can lead to major gains in conversion rate when changes are based on data, not guesswork.
- Certain listing elements have a bigger impact on buyer decisions than others, so knowing where to focus your effort matters.
- Tracking results before and after changes helps you understand what worked and apply those lessons to future updates.
The Conversion Challenge and Starting Baseline
Before the rebuild, your listing had a conversion rate of 1.8%, well below the category average of 4.2%. Traffic was steady, but shoppers weren’t buying, and the data pointed to specific problems you could fix.
Original Listing Performance
Your listing pulled in about 12,000 monthly visitors but converted only 216 of them into sales. The click-through rate from search results sat at 3.1%, which showed people found the listing. The drop-off happened after that first click.
Your bounce rate was 68%, meaning most visitors left within seconds. Your average time on page was just 14 seconds. These numbers told you shoppers weren’t finding what they needed fast enough to stay engaged.
| Metric | Baseline Value |
|---|---|
| Conversion Rate | 1.8% |
| Monthly Visitors | 12,000 |
| Bounce Rate | 68% |
| Avg. Time on Page | 14 seconds |
Primary Friction Points
Your main image didn’t show the product in use, so shoppers couldn’t picture how it worked. The title was packed with keywords but didn’t explain the actual benefit.
Your bullet points listed features without connecting them to real problems buyers wanted solved. The product description was one long paragraph, hard to scan on mobile devices.
You also lacked social proof above the fold. Reviews existed, but shoppers had to scroll past several images before seeing any of them. This gap left first-time visitors without the reassurance they needed to commit.
Rebuild Strategy and Prioritized Changes
The rebuild focused on three areas: understanding what customers actually wanted, fixing the offer itself, and reorganizing the page so key information appeared in the right order. Each change was tested and ranked by expected impact before development started.
Customer Intent Research
You start by figuring out what questions your customers are actually asking before they buy. This means reading through past customer service tickets, reviews, and search terms that led people to the page.
For this rebuild, the team pulled data from three sources:
- Search Console queries – showed which keywords brought traffic but low conversions
- Customer support logs – revealed common objections about sizing and shipping time
- Competitor reviews – highlighted gaps competitors weren’t addressing
This research showed that shoppers cared most about return policy details and product durability. Neither point was mentioned in the original listing.
Offer and Value Proposition
Once you know what customers care about, you need to make sure your offer actually answers those concerns. The original listing led with a generic tagline and a price.
The rebuild replaced this with a clear value statement in the first line: what the product does, who it’s for, and one proof point. A 60-day return window, which used to be buried in the FAQ, moved to the top of the page.
The team also added a comparison table showing how the product stacked up against two competitor models on price, warranty, and materials. This gave shoppers a reason to choose the product without leaving the page.
Page Structure and Content Hierarchy
You need to put the most important information where people will actually see it. Heat map data from the original listing showed that 80% of visitors never scrolled past the first two sections.
The rebuild moved the following elements above the fold:
- Value proposition and key benefit
- Price and return policy
- Top three product specs
- First customer review with a photo
Technical details, sizing charts, and shipping information were moved into expandable sections lower on the page. This kept the page shorter at first glance while still giving detail-focused shoppers a place to find answers.
Key Listing Elements That Changed
Three areas drove most of the results: your titles, your visuals, and your written content. Each one changed how shoppers found your product and decided whether to buy it.
Product Titles and Search Terms
Your original title packed in keywords but buried the product name and main benefit. You moved the brand and key feature to the front, then trimmed filler words.
You also rebuilt your backend search terms from scratch. Old terms repeated words already in the title, which wasted space. New terms covered:
- Misspellings and alternate phrasings
- Related use cases customers search for
- Seasonal or trending terms tied to your category
This gave your listing a wider reach without changing your ad spend.
Images, Video, and Visual Proof
Your main image went from a plain product shot to one showing scale and context. You added six supporting images that answer common questions before a shopper reads the description.
The new image set includes:
| Image Type | Purpose |
|---|---|
| Size comparison | Shows real-world scale |
| In-use lifestyle shot | Builds context |
| Infographic | Highlights top 3 features |
| Close-up detail | Shows material and build |
| Comparison chart | Sets your product against alternatives |
You also added a short video showing the product in use. This gave shoppers visual proof instead of just written claims.
Descriptions, Features, and Specifications
Your bullet points used to list features without explaining why they mattered. You rewrote each one to pair a feature with a clear benefit.
Your product description also changed structure. It now opens with the main problem your product solves, then moves into details. You added a specifications table so shoppers can compare exact dimensions, materials, and compatibility without searching through paragraphs.
This gave shoppers faster answers and reduced pre-purchase questions.
Measuring the 304.6% Conversion Increase

To confirm the results were real and not just luck, you need to look at how the test was tracked and what the numbers showed before and after the rebuild.
Testing Period and Tracking Method
You tracked this listing over a 60-day period, split evenly before and after the rebuild. This gave you enough data to spot real trends instead of short-term spikes.
You used Amazon’s Business Reports to pull conversion data daily. This let you compare unit session percentage side by side across both periods.
You also controlled for outside factors. Here’s what you kept steady during the test:
- Price: No changes during either period
- Ad spend: Kept within 5% of the same daily budget
- Inventory: Fully stocked with no stockouts
- Season: No major holidays or sales events
This setup made sure the conversion boost came from the listing changes, not outside noise.
Before-and-After Performance Results
Before the rebuild, your listing converted at 2.1%. After the changes, it jumped to 8.5%. That’s a 304.6% increase in conversion rate.
Sessions stayed steady during both periods, averaging around 1,200 per day. This means the increase came from the listing itself, not from more traffic.
Units ordered per day rose from about 25 to 102. Revenue followed the same pattern, growing at a similar rate since price didn’t change.
Here’s a quick breakdown of the key metrics:
| Metric | Before | After |
|---|---|---|
| Conversion Rate | 2.1% | 8.5% |
| Daily Sessions | ~1,200 | ~1,200 |
| Units Ordered/Day | ~25 | ~102 |
These numbers show the rebuild directly improved how well the listing turned visitors into buyers.
Implementation Lessons for Future Listing Updates

This rebuild taught you which changes drove real results and which ones need constant attention. You can apply these lessons to your next listing update to save time and get better results faster.
Changes With the Greatest Impact
Three changes made the biggest difference in your conversion rate.
- New main image: Switching to a lifestyle photo with clear product context boosted click-through rate by 42%
- Rewritten first three bullet points: Leading with benefits instead of features increased add-to-cart rate by 31%
- Updated title structure: Placing the main keyword and key benefit in the first 60 characters improved search visibility
You should prioritize these three areas first in any future listing update. They require less work than a full rebuild but deliver most of the results.
Smaller changes, like backend keyword updates, had minimal impact on their own. They only helped when paired with the bigger changes above.
Ongoing Optimization Priorities
Your listing needs regular check-ins, not a one-time fix. Set a schedule to review these areas every 60 to 90 days.
Image testing: Rotate secondary images to test different angles and use cases. Track which images keep shoppers on the page longer.
Review monitoring: Watch for recurring complaints or questions in reviews. Update your bullet points or Q&A section to address them directly.
Search term tracking: Check which keywords bring in traffic each month. Adjust your title and backend terms if search patterns shift.
You should treat your listing as a living document. Small, consistent updates based on real data will keep your conversion rate steady over time.
Frequently Asked Questions
Here are answers to common questions about the listing rebuild, the specific changes made, and how you can measure similar results on your own listings.
What changes were made during the listing rebuild to improve conversion performance?
You saw updates to five main areas: main image, title, bullet points, product description, and backend keywords. Each image got a redesign to show the product in use rather than just on a white background.
The title was rewritten to lead with the main keyword and key benefit. Bullet points were shortened and reordered to answer buyer questions in the first few words.
Which listing elements had the greatest impact on the 304.6% conversion lift?
Your main image and the first three bullet points drove most of the improvement. The main image switch from a plain product shot to a lifestyle image with clear text overlays accounted for close to half the lift on its own.
The bullet points that addressed common objections, like sizing or material quality, reduced returns and boosted buyer confidence before checkout.
How was the conversion increase measured and validated?
You can track this through a 60-day A/B split test using Amazon’s Manage Your Experiments tool. The test ran the old listing against the new one with equal traffic split.
Conversion rate was measured as units ordered divided by sessions. The 304.6% figure reflects the percentage increase between the control version and the rebuilt version, not a raw conversion rate.
What was the timeline for implementing and evaluating the rebuilt listing?
The rebuild took three weeks to plan, design, and write. This included two rounds of image revisions and one round of copy edits based on early customer feedback.
Once live, the test ran for 60 days to collect enough data for statistical significance. You then spent one additional week reviewing the full results and confirming the lift held steady.
Did traffic quality, pricing, or advertising changes contribute to the results?
Price stayed the same throughout the entire test period. Advertising spend and campaign structure also remained unchanged, so paid traffic volume didn’t skew the numbers.
Traffic sources were split evenly between the two listing versions during the test. This means the lift came directly from the listing content changes, not from external factors like a price drop or a new ad campaign.
What lessons from this rebuild can be applied to other product listings?
You can apply three takeaways to other listings you manage. First, lead with your main keyword and biggest benefit in the title, not filler words.
Second, address buyer objections directly in your first three bullet points. Third, test one lifestyle image with text overlays as your main image, since this had the single largest measurable effect in this case.
{
“@context”: “https://schema.org”,
“@type”: “FAQPage”,
“mainEntity”: [
{
“@type”: “Question”,
“name”: “What changes were made during the listing rebuild to improve conversion performance?”,
“acceptedAnswer”: {
“@type”: “Answer”,
“text”: “Updates were made to five main areas: main image, title, bullet points, product description, and backend keywords. Each image was redesigned to show the product in use rather than just on a white background. The title was rewritten to lead with the main keyword and key benefit, and the bullet points were shortened and reordered to answer buyer questions in the first few words.”
}
},
{
“@type”: “Question”,
“name”: “Which listing elements had the greatest impact on the 304.6% conversion lift?”,
“acceptedAnswer”: {
“@type”: “Answer”,
“text”: “The main image and the first three bullet points drove most of the improvement. Switching the main image from a plain product shot to a lifestyle image with clear text overlays accounted for close to half the lift on its own. The bullet points that addressed common objections, like sizing or material quality, reduced returns and boosted buyer confidence before checkout.”
}
},
{
“@type”: “Question”,
“name”: “How was the conversion increase measured and validated?”,
“acceptedAnswer”: {
“@type”: “Answer”,
“text”: “It was tracked through a 60-day A/B split test using Amazon’s Manage Your Experiments tool, running the old listing against the new one with an equal traffic split. Conversion rate was measured as units ordered divided by sessions. The 304.6% figure reflects the percentage increase between the control version and the rebuilt version, not a raw conversion rate.”
}
},
{
“@type”: “Question”,
“name”: “What was the timeline for implementing and evaluating the rebuilt listing?”,
“acceptedAnswer”: {
“@type”: “Answer”,
“text”: “The rebuild took three weeks to plan, design, and write, including two rounds of image revisions and one round of copy edits based on early customer feedback. Once live, the test ran for 60 days to collect enough data for statistical significance, followed by one additional week reviewing the full results and confirming the lift held steady.”
}
},
{
“@type”: “Question”,
“name”: “Did traffic quality, pricing, or advertising changes contribute to the results?”,
“acceptedAnswer”: {
“@type”: “Answer”,
“text”: “Price stayed the same throughout the entire test period. Advertising spend and campaign structure also remained unchanged, so paid traffic volume didn’t skew the numbers. Traffic sources were split evenly between the two listing versions during the test, which means the lift came directly from the listing content changes, not from external factors like a price drop or a new ad campaign.”
}
},
{
“@type”: “Question”,
“name”: “What lessons from this rebuild can be applied to other product listings?”,
“acceptedAnswer”: {
“@type”: “Answer”,
“text”: “Three takeaways apply to other listings. First, lead with your main keyword and biggest benefit in the title, not filler words. Second, address buyer objections directly in your first three bullet points. Third, test one lifestyle image with text overlays as your main image, since this had the single largest measurable effect in this case.”
}
}
]
}